Measure Nearby Places
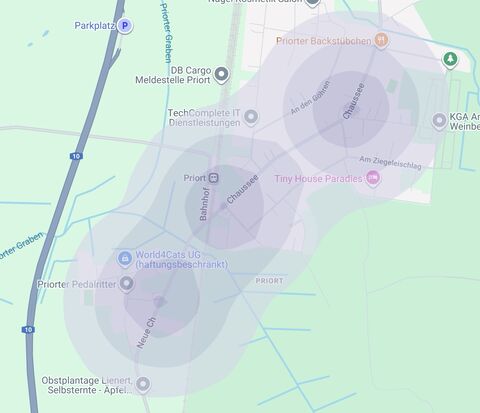
For each grid point, Mapalizer measures the distance to relevant OpenStreetMap points, lines, and areas.
A map toolbar for your search and results pages.
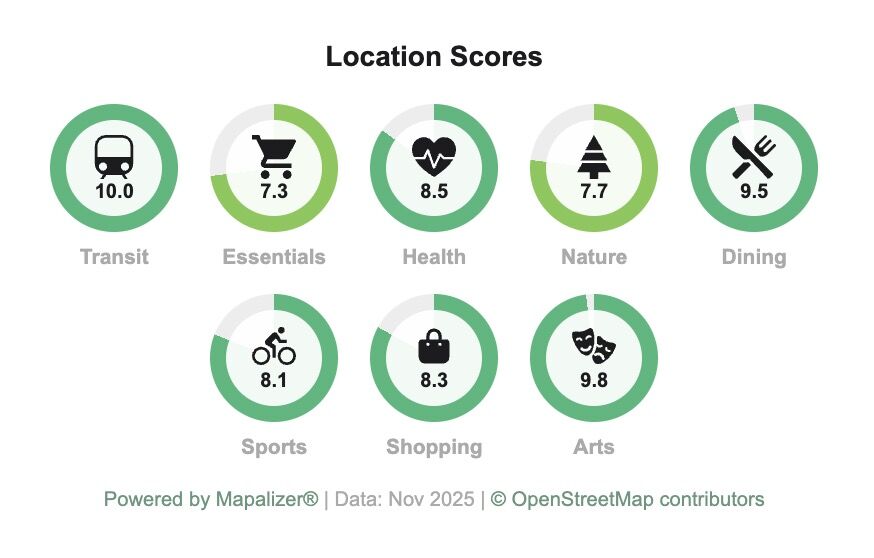
A score widget for your listing detail pages.
Worldwide coverage: OpenStreetMap data for every city on earth.
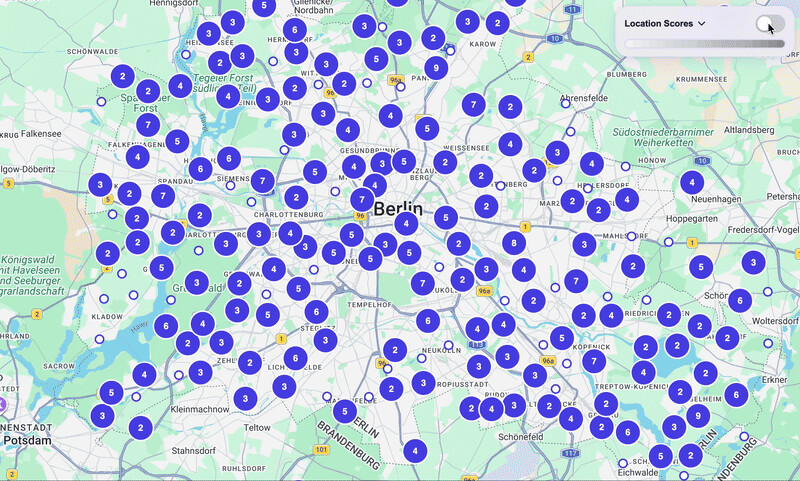
Add location scoring to your map pages and your listing pages, all with one script tag.
OpenStreetMap data covers every country on earth, wherever your listings are.
No credit card. No demo call. Free under 10,000 pageviews/month. Try before you commit.
The Mapalizer Toolbar sets no cookies and does not track individual visitors. Optional third-party map services remain under the website operator's control.
One API works across all three map libraries, so you never need to rewrite your integration when changing libraries.
Colors, position, opacity, category weights, and threshold: all via JSON config.
Available in 100+ languages, configurable per-call for both the map toolbar and listing-page widget.
As visitors adjust categories and the score threshold, your map can hide or gray properties that fall below their preferences.
Mapalizer keeps working from city view to street view, so visitors can compare location quality at any map zoom.
Mapalizer helps visitors evaluate neighborhood quality faster, while giving property websites a richer, more informative map experience.
Mapalizer turns nearby OpenStreetMap features into category scores, then combines the categories each visitor cares about into an interactive location layer.
For each grid point, Mapalizer measures the distance to relevant OpenStreetMap points, lines, and areas.
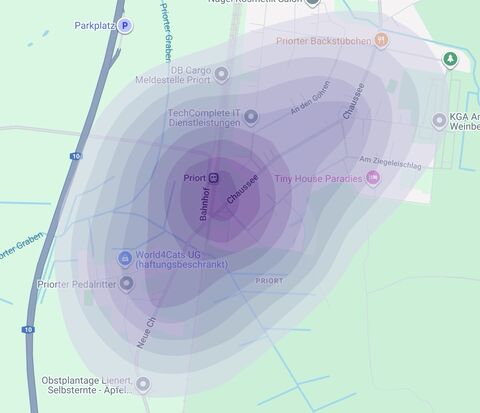
Nearby places contribute more. Within each subcategory, only the strongest match counts, so similar amenities do not inflate the result.
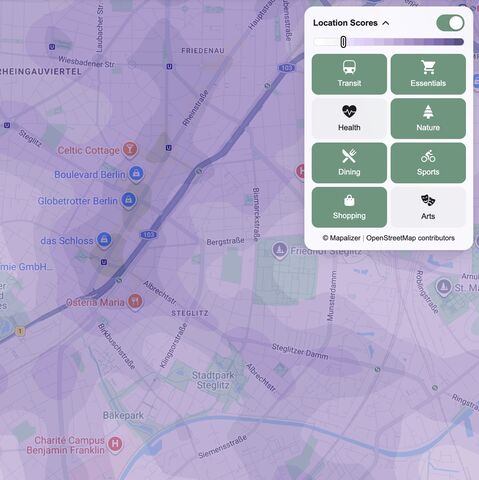
Selected category scores are combined and rendered as an interactive vector contour layer.
One API, three map libraries. Switch between them without rewriting your integration.
// Google Maps
const map = new google.maps.Map(document.getElementById('map'), {
    center: { lat: 52.505, lng: 13.389 },
    zoom: 13,
});
// ...
mapalizer.addToMap(map, {
    auth: {
        siteToken: 'mpl_pk_live_REPLACE_ME'
    }
});
// Leaflet const map = L.map('map').setView([52.505, 13.389], 13); L.tileLayer('https://{s}.tile.openstreetmap.org/{z}/{x}/{y}.png', { attribution: '© <a href="https://www.openstreetmap.org/copyright" target="_blank" rel="noopener noreferrer">OpenStreetMap contributors</a>' }).addTo(map); // ... mapalizer.addToMap(map, { auth: { siteToken: 'mpl_pk_live_REPLACE_ME' } });
// Mapbox JS (Leaflet-based)
L.mapbox.accessToken('your-mapbox-token');
const map = L.mapbox.map('map', 'mapbox.streets').setView([52.505, 13.389], 13);
// ...
mapalizer.addToMap(map, {
    auth: {
        siteToken: 'mpl_pk_live_REPLACE_ME'
    }
});